
Completing Drones Firmware at Beetroot Academy
Published:
On September 9, 2026, I successfully completed Drones Firmware at Beetroot Academy. My final project was a Flightory Stallion VTOL aircraft running ArduPlane. It combined a real aircraft build with repeatable simulator experiments. A flight that ended in a crash also became part of the work: I had to explain the failure using logs and a physical inspection.
View my course certificate on TrueOriginal.
The course covers flight-stack architecture and practical configuration, including Betaflight and ArduPilot, with PX4 and INAV as alternative stacks. I focused on ArduPlane’s QuadPlane subsystem. The question behind my project was whether I could explain each configuration decision and then check its effect against recorded behavior.
This is the English write-up of the project presentation, with the mission recording and supporting figures. The original slides are available as a PDF.
A fixed-wing aircraft that can take off vertically
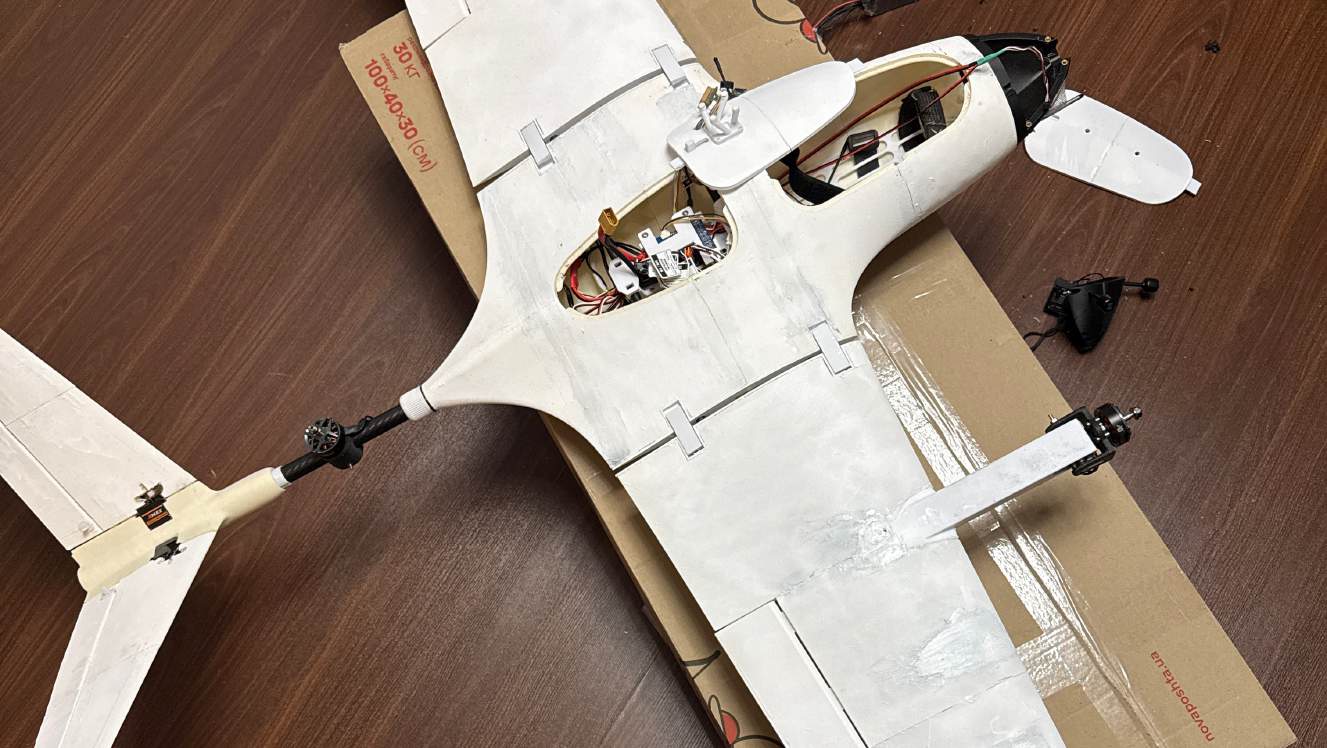
The Stallion has two independently tilting front motors and a fixed rear lift motor. In vertical flight, all three provide lift. For forward flight, the front motors tilt and the wing carries the aircraft. Differential tilt also provides yaw control: the two front motors can point in slightly different directions.
That geometry made ArduPlane a practical choice. Its QuadPlane subsystem supports a tilt-tricopter, and the quadplane-tilttrivec simulator model provided a starting point for the mission tests.
| Part of the aircraft | Project configuration |
|---|---|
| Flight controller | Matek H743-WING V3 |
| Propulsion | Three F90 KV1300 motors, each with a separate 45 A ESC; 7×5 propellers |
| Motor tilt | Two Corona DS939HV servos |
| Control surfaces | Four EMAX ES08MAII servos for the wing and V-tail |
| Navigation sensors | M10 GNSS receiver and compass, plus a pitot airspeed sensor |
| Radio link | RadioMaster TX16S with ExpressLRS / CRSF |
| Battery used in the physical flight | HRB Graphene LiPo, 6S, 6000 mAh |
These are the components documented in the project, rather than a recommended bill of materials. Several parts still needed further qualification. The exact GNSS board identity, for example, remained an open item in the final checklist.
I kept the official ArduPlane 4.7.1 simulator baseline separate from the custom firmware used on the physical controller. A result from one configuration had to stay attached to that configuration.
A complete mission in the simulator
Software-in-the-loop simulation, or SITL, runs the flight software against a simulated aircraft. It let me repeat the same mission and inspect the resulting DataFlash logs before drawing conclusions about a parameter change.
The demonstration mission started with a vertical takeoff to 30 m. It then transitioned to fixed-wing flight and visited seven waypoints at commanded heights between 55 and 80 m. A separate mission command set the airspeed to 18 m/s, or 64.8 km/h. The final command returned the aircraft to Home for a vertical landing and automatic disarm.
In the September 9 demonstration run, the aircraft was armed for 199.88 seconds. The forward transition took 9.03 seconds. It visited every waypoint and stayed inside the 600 m geofence, with a maximum recorded distance of 351.71 m from Home and a maximum relative altitude of 75.39 m.
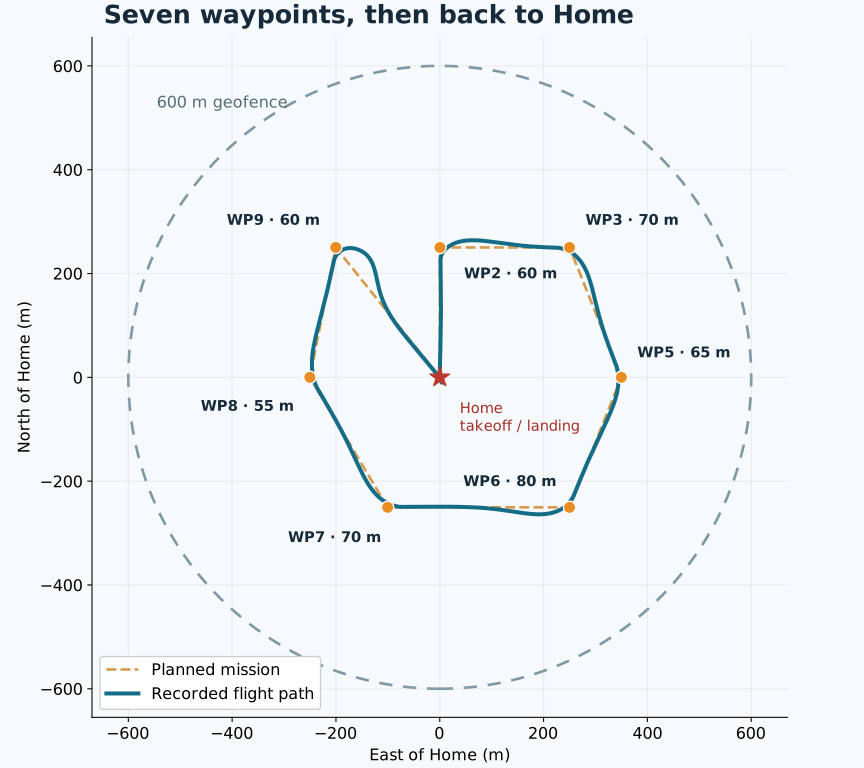
Before arming, that run recorded ten satellites and GPS HDop of 1.21. The maximum estimator variance reported by the health check was 0.00609, below its 0.5 threshold. There was no IMU clipping, and arming checks weren’t bypassed. These readings describe the simulated sensors; they don’t document calibration of the physical aircraft.
What happened when the mission was interrupted
The original campaign contained eight accepted runs. Besides the nominal mission, it covered low-throttle failsafe and a deliberate geofence breach. Other runs tested temporary GPS exclusion and compared parameter or firmware changes under controlled conditions.
For the later presentation demonstration, I also tested complete loss of RC input. The aircraft was already in fixed-wing flight when the simulated receiver stopped supplying input. The recorded response was:
| Time after RC loss | Recorded behavior |
|---|---|
| 1.20 s | Entered CIRCLE after the short failsafe |
| 5.00 s | Entered RTL, or return to launch |
| 19.53 s | Entered QRTL for the VTOL return and landing phase |
| 67.72 s | Completed landing and disarmed |
There was a useful reporting trap here. I had started this run with the nominal mission evaluator, which expected every waypoint to be visited. Returning early left some waypoints unvisited, so that evaluator reported a failure. The logs still confirmed the RC-loss response and completed landing. I retained the failed nominal result and explained what the separate failsafe evidence established.
The geofence test used a smaller, 300 m boundary. The route crossed it and triggered return followed by vertical landing. In the GPS-exclusion test, the aircraft stayed in a mode that didn’t depend on position during the interruption. Navigation recovery waited for the estimator to recover before requesting QRTL. Neither test established the performance of a real radio link or a real GNSS receiver under interference.
Testing a plausible tuning change
One of the more useful results was a rejected hypothesis. The baseline showed a brief disturbance in altitude and airspeed control after the forward transition. I expected slower motor tilt to make the transfer from vertical lift to wing-borne flight gentler.
I changed only Q_TILT_RATE_UP, from 40°/s to 15°/s, and repeated the same mission with the same firmware and wind conditions.
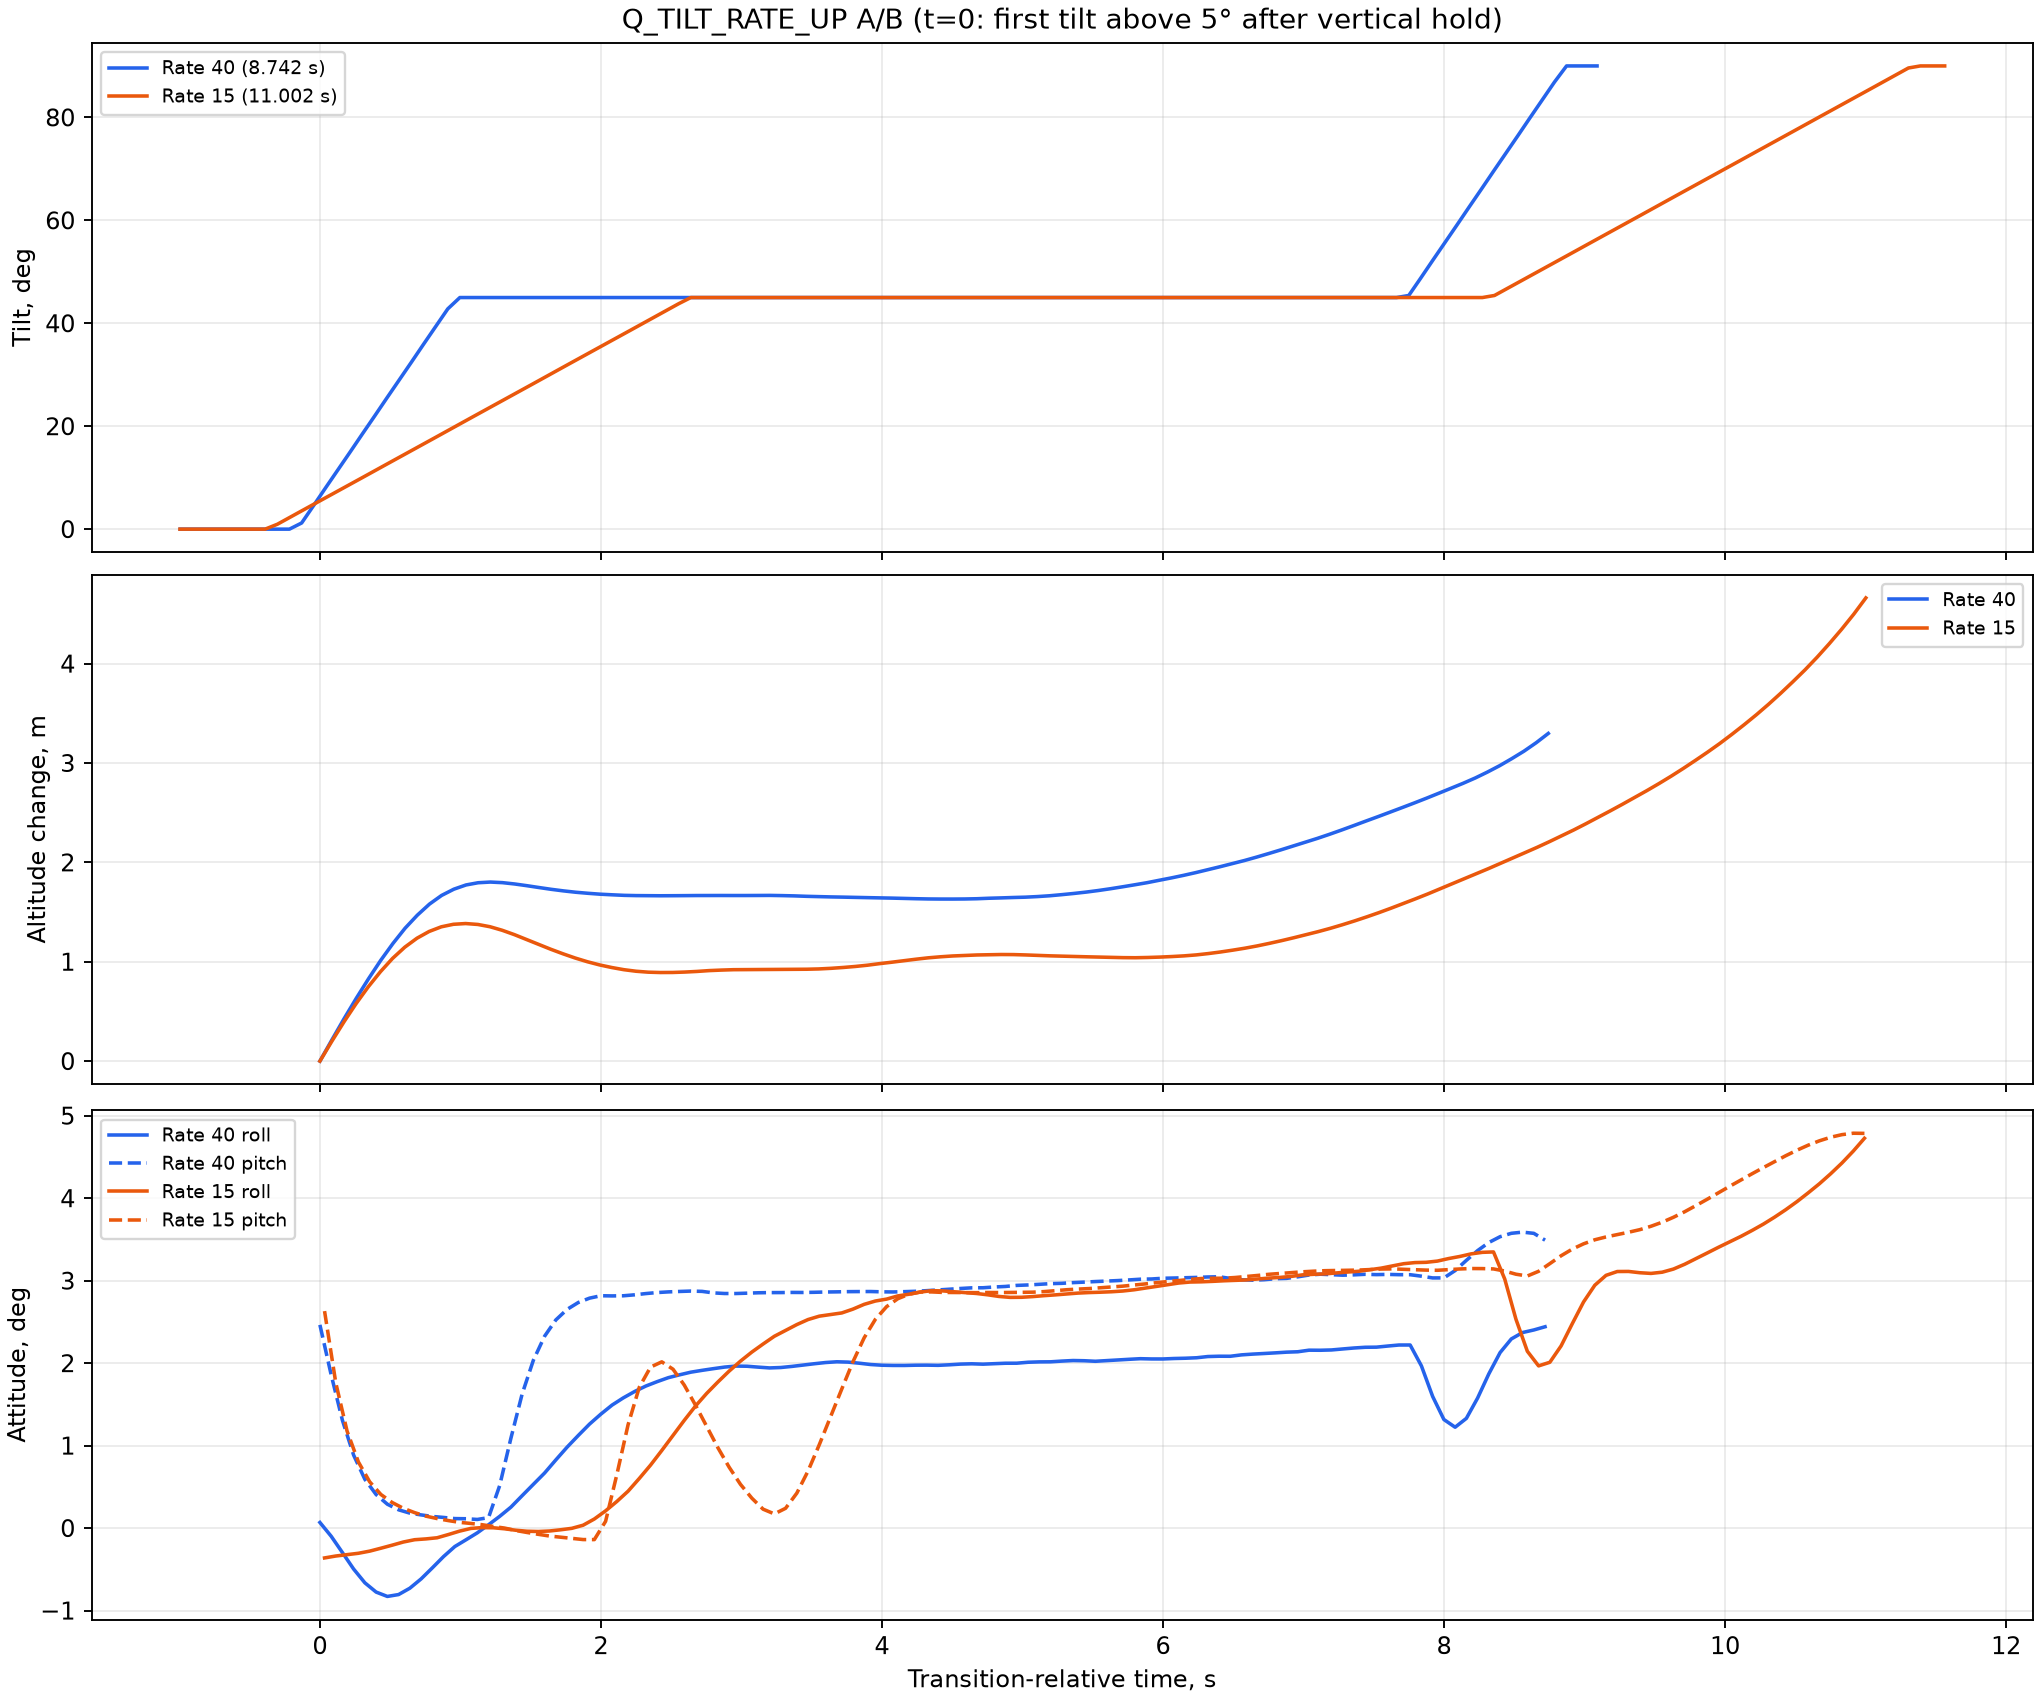
| Measured result | 40°/s baseline | 15°/s candidate |
|---|---|---|
| Forward transition | 8.74 s | 11.00 s |
| Altitude change during transition | +3.30 m | +4.66 m |
| Roll-error RMS | 0.36° | 0.50° |
| Maximum absolute roll | 2.44° | 4.73° |
| Maximum fixed-wing airspeed error | 7.87 m/s | 9.85 m/s |
Both runs completed the mission. The slower setting nevertheless made the transition longer and worsened the measured tracking. I rejected 15°/s for the SITL baseline. The experiment was useful because it replaced an attractive explanation with a measured result.
Those numbers also didn’t justify copying 40°/s straight onto the real aircraft. The simulator didn’t reproduce servo backlash or the load on the installed tilt mechanisms. Their physical behavior needed a separate loaded test.
Two firmware changes, with different evidence
The presentation also explains why the physical controller used a custom ArduPlane build. One change addressed estimator startup without a GPS fix. In my reproduction, EKF3 didn’t initialize for the intended QSTABILIZE test without GPS. An opt-in bootstrap change altered that behavior: the simulator A/B test recorded takeoff and landing in QSTABILIZE, with EKF3 supplying all 97 attitude records during the armed interval.
That experiment concerned attitude and vertical-state estimation. It didn’t establish position navigation without GPS. Modes such as AUTO and QRTL still needed a usable position estimate.
The other change concerned the roll contribution in tilt-vectoring. I compared official firmware with a candidate correction in an 8 m/s simulated crosswind. Both runs completed the seven-waypoint mission and landed. Some metrics improved while others worsened, and the control run didn’t reproduce the specific failure the patch targeted. The result supported completion of that test scenario; it left the effectiveness of the correction inconclusive.
The real-flight log couldn’t settle that question either. It contained only QSTABILIZE flight, with the logged base tilt at zero throughout. The particular roll contribution affected by the patch wasn’t exercised under that condition. A successful vertical takeoff, by itself, couldn’t validate a correction intended for tilted-motor behavior.
Making the radio setup explicit
The transmitter configuration was part of the project, too. My TX16S used a dedicated STALLION VTOL model in EdgeTX. The left stick controlled throttle and yaw; the right stick controlled pitch and roll. ArduPlane performed the V-tail and motor mixing.
The model assigned separate switches to arming, an FBWA override, and GPS exclusion. A six-position control selected the configured flight modes. That mapping was documented, but its presence in the configuration wasn’t evidence that every mode had been tested in flight.
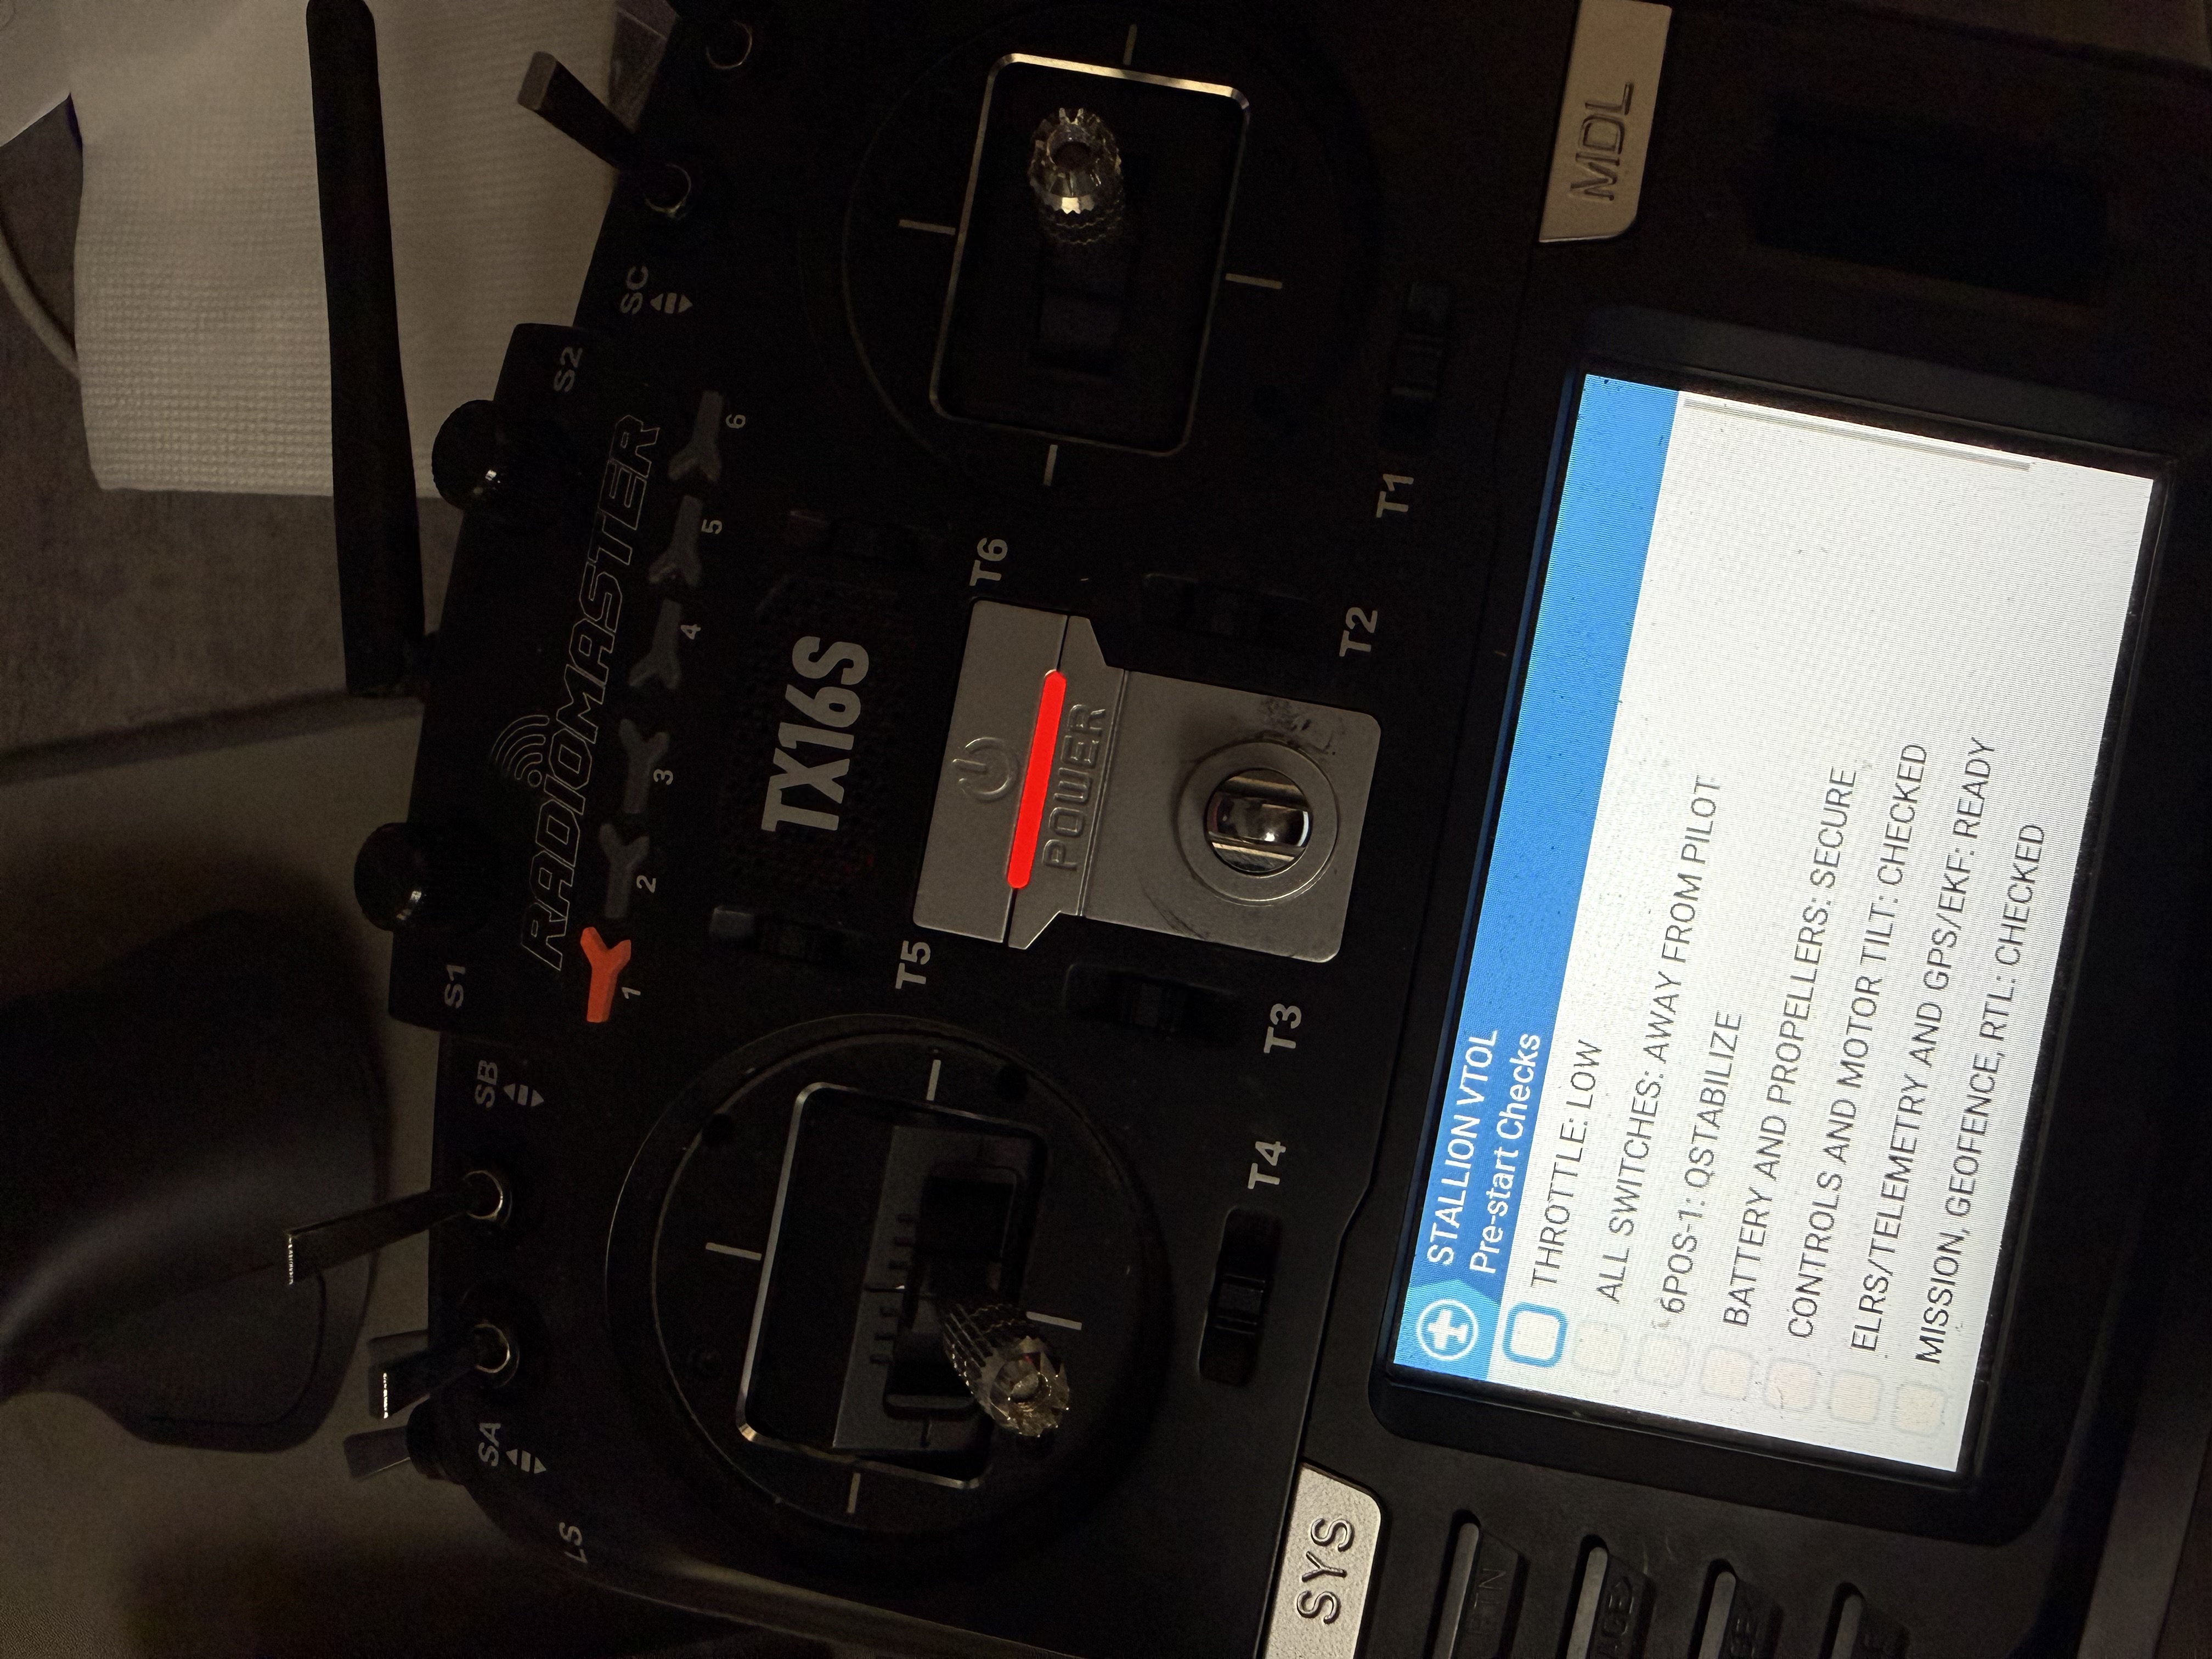
The checklist starts with low throttle and known switch positions. It also covers the control surfaces and motor tilt, then the telemetry and navigation state. The complete project preflight checklist has more than fifteen items; the short version on the transmitter makes the immediate checks visible at startup.
The real-flight incident
On the third launch attempt, the Stallion took off. The flight ended in a crash, and investigating it became a substantial part of the final presentation.
I aligned the DataFlash records around the loss of control. At about 39.55 seconds from the start of the log, the aircraft departed from the commanded attitude. At 39.619 seconds, its roll rate was −126.7°/s while the controller requested +32.6°/s. Pitch showed the same pattern: actual motion opposed the corrective command.
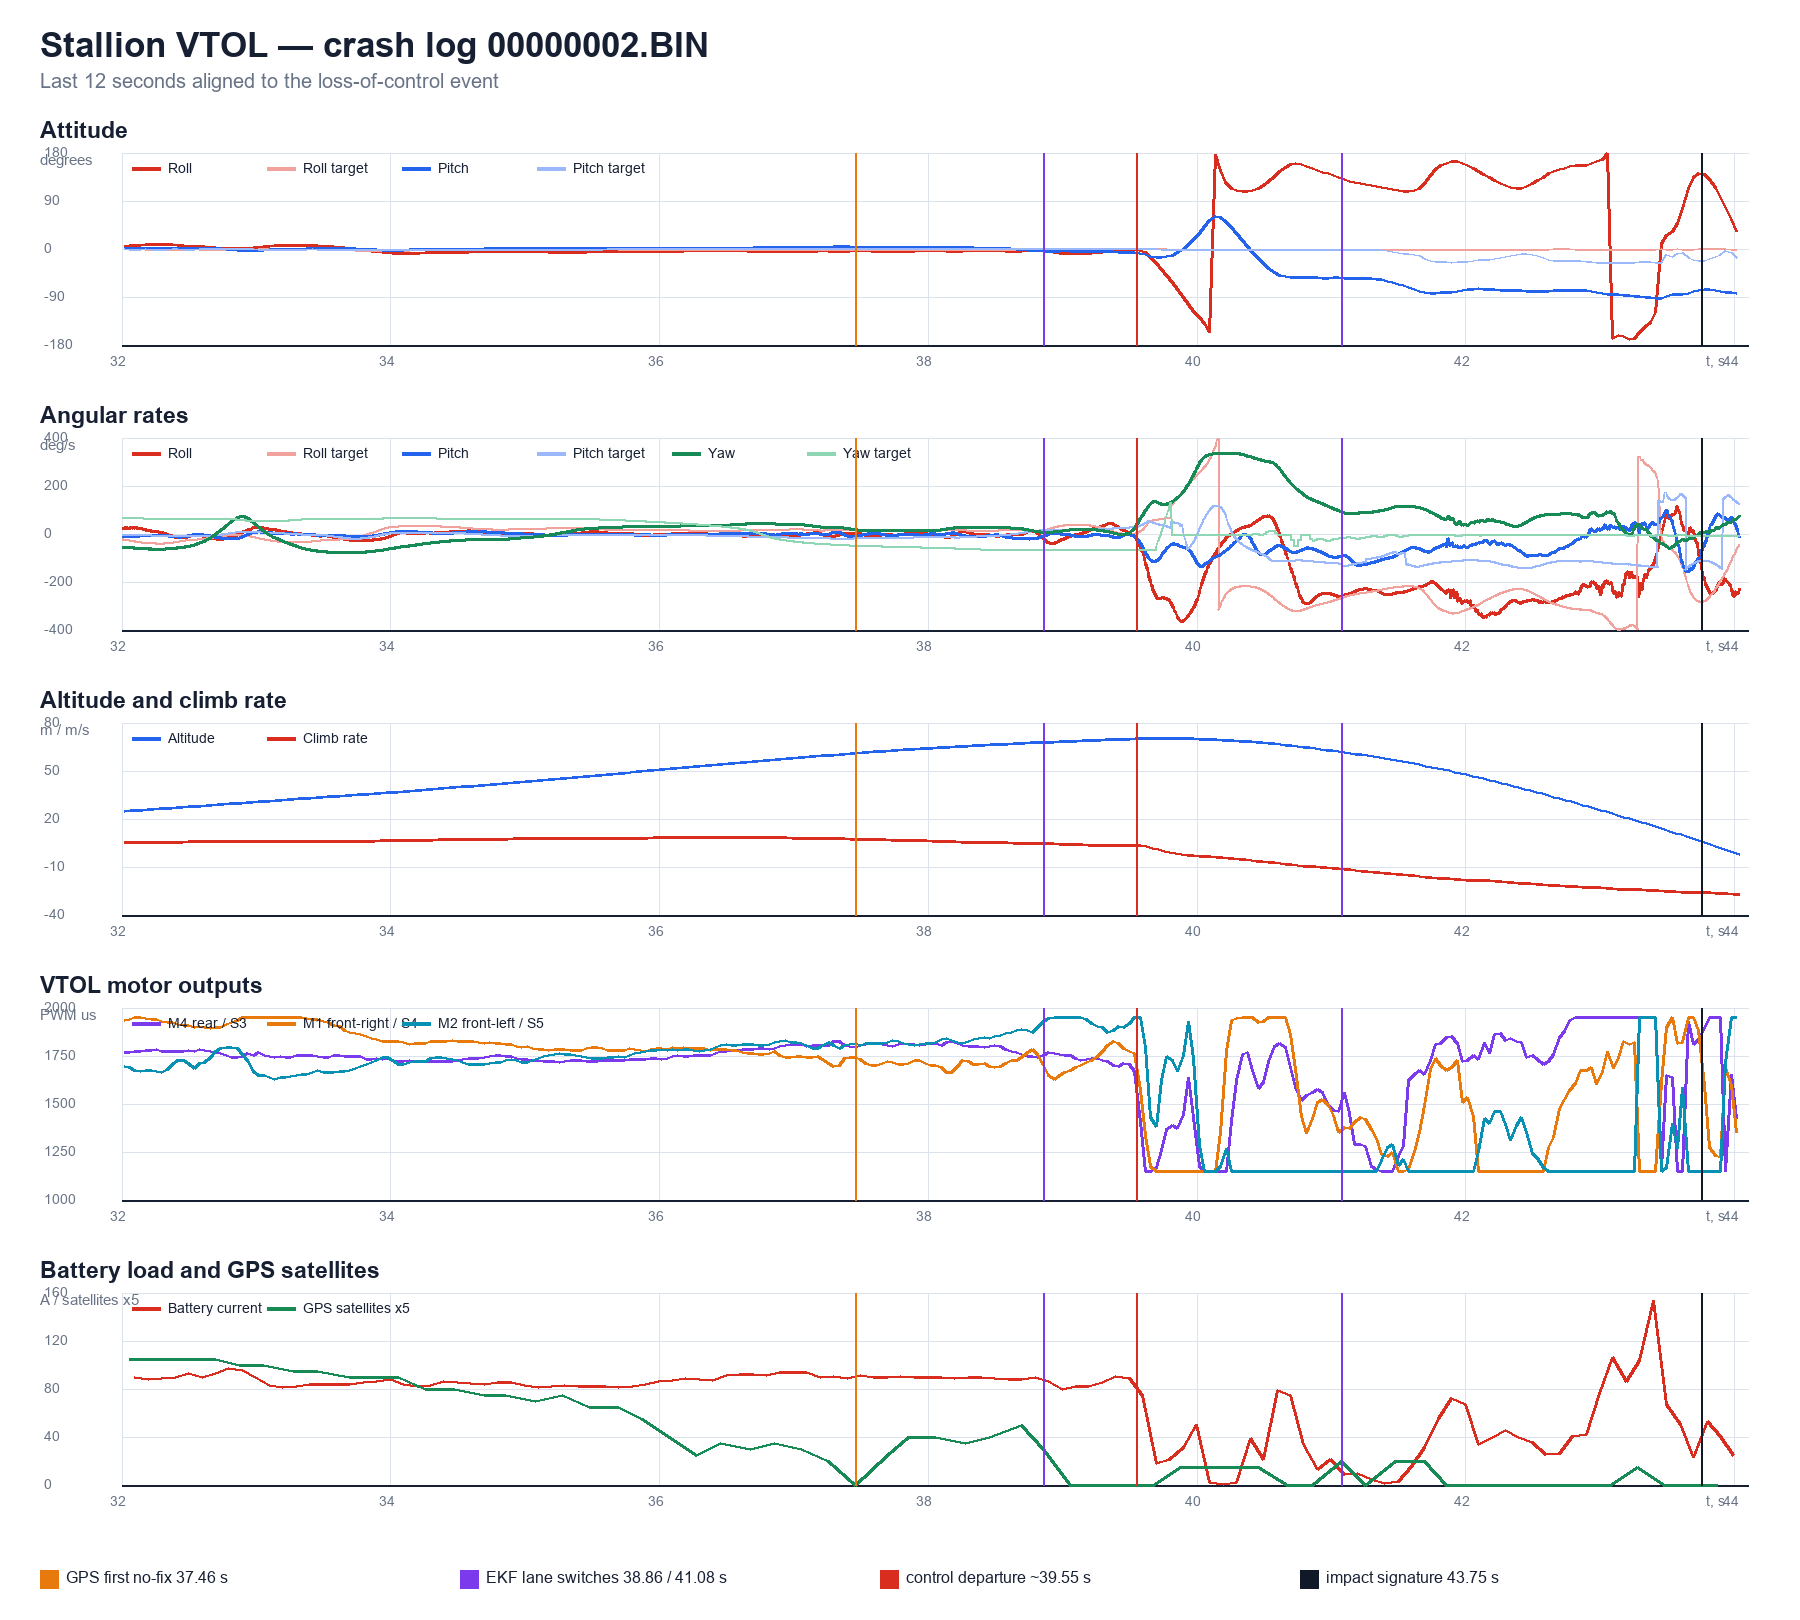
GPS and estimator health also deteriorated. The first recorded loss of GPS fix was at 37.46 seconds, followed by an estimator lane switch at 38.86 seconds. Neither IMU reported clipping. The largest vibration peak occurred during the fall, so it couldn’t simply be treated as evidence that vibration had caused the original departure.
The physical inspection supplied evidence the logs couldn’t provide: a plastic mount had broken and the left front motor had detached. A twisted power wire supported the conclusion that the detached motor had rotated. I kept the source of that conclusion explicit. The log showed loss of control authority; the inspection identified the mechanical failure.
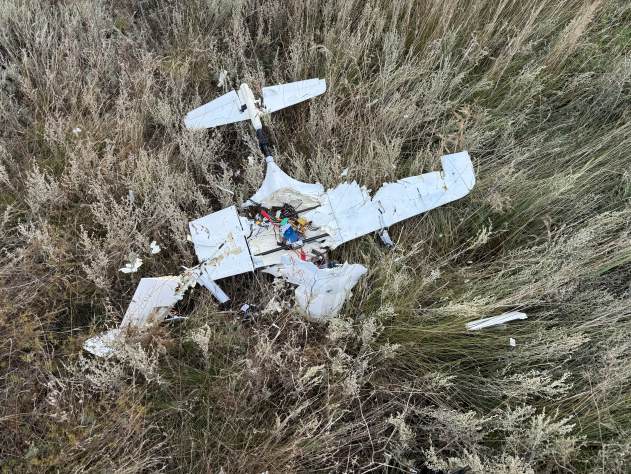
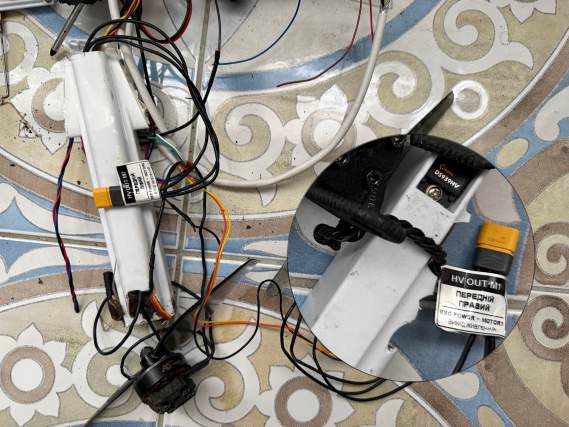
This changed the next build’s priorities. Stronger motor mounts and loaded mechanical checks come first. My plan for a T2 Cruza airframe is to establish fixed-wing flight before adding VTOL, so each test introduces a smaller change.
What I completed, and what remained open
The final project self-assessment counted 24 of 27 core criteria, or 88.89%, against an 80% completion threshold. Two bonus criteria covered the GPS-denied simulation and a custom preflight checklist. Those percentages describe the evidence audit in the slides; they aren’t an instructor-issued grade.
The remaining partial criteria were recorded openly: the exact GNSS module identity needed confirmation, completed compass calibration wasn’t established, and the battery failsafe wasn’t configured. Course completion didn’t close those engineering tasks.
The work gave me a repeatable way to investigate a flight system. I could connect a configuration to a specific test and use the saved records to challenge my own explanation. The rejected tilt-rate change was one example. The distinction between the flight log and the physical inspection was another.
Presentation and course record
Download the final project presentation (PDF, Ukrainian, 13 pages).
The course completion is also recorded in Events. This article draws on the presentation and its September 9 mission evidence, together with the matched simulation runs and the physical-flight analysis. The map has been redrawn with English labels; the photographs and recording come from the project materials.